Cyclone and Weather Technologies
Organisations such as the Bureau of Meteorology use a range of technologies to study weather systems, in particular, cyclones through mediums such as satellite images (standard, infared and thermal), radar images, weather maps, mean sea-level pressure (MSLP) charts, and loops of several of these mediums to portray the path of these weather systems over a period of time. These organisations
study these images maps and are able to determine the type of weather system, for example if it is a tropical low or a tropical cyclone, determine the intensity of the system and categorise it, determine if it is likely for the system to pass or weaken without hitting or if it will in fact hit and pass through a populated area. The Bureau of Meteorology monitor these images and maps frequently from tropical warning centres in Darwin, Brisbane and Perth, observing the development of any weather systems and cyclone, issuing frequent 'cyclone watch' or 'cyclone warning' announcements when appropriate (National Archives of Australia, 2014).
study these images maps and are able to determine the type of weather system, for example if it is a tropical low or a tropical cyclone, determine the intensity of the system and categorise it, determine if it is likely for the system to pass or weaken without hitting or if it will in fact hit and pass through a populated area. The Bureau of Meteorology monitor these images and maps frequently from tropical warning centres in Darwin, Brisbane and Perth, observing the development of any weather systems and cyclone, issuing frequent 'cyclone watch' or 'cyclone warning' announcements when appropriate (National Archives of Australia, 2014).
technologIEs and images in 1974
In 1974 when Cyclone Tracy hit Darwin, there were means of tracking, forecasting and studying tropical cyclones and their paths, though there wasn't sufficient technology for the residents of Darwin to use to view these images and fully understand the severity of this cyclone as the internet had not yet been introduced to Australia. Even if this were so, the images which were used at the time of Tracy were very simplistic and contained no great deal of information, and those that did are not easily understood by those who aren't in the profession of decoding and interpreting these types of images.
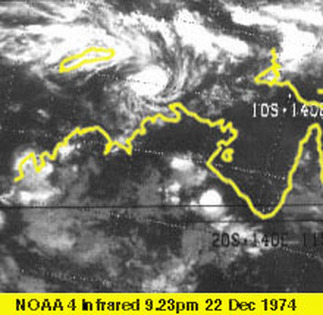
Even though this technology for forecasting, tracking and studying tropical cyclones was basic, it still enabled the Bureau of Meteorology to track the unpredictable cyclone Tracy from the time it formed in the Timor sea, through to the time it passed Darwin, only to unexpectedly turn completely around and head back for Darwin. The Bureau of Meteorology used the technology they had to warn the residents of Darwin in a timely manner that they were at risk of a cyclone hitting, though the lack of knowledge many of these residents had about cyclones led them to believe that they had nothing to worry about, continuing with their Christmas festivities, ignoring these serious warnings.
The images below show the path of Cyclone Tracy through the technology that was available in 1974. Figures 1.1, 1.2 and 1.3 are all quite similar images of the path that Cyclone Tracy took, while figures 1.4 and 1.5 show radar images and loops of the cyclone itself and it's path through Darwin.
|
Figure 1.1
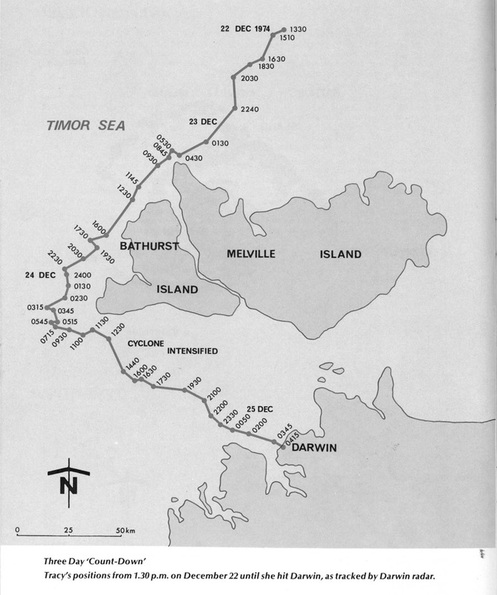
Figure 1.4 - Northern Territory Collection of the Northern Territory Library
|
Figure 1.2 - Bureau of Meteorology
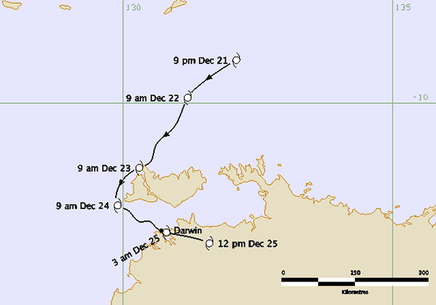
Figure 1.3 - Bureau of Meteorology
Figure 1.5 - National Oceanic and Atmospheric Administration
|
CURRENT technologies and images
In 1974 when Cyclone Tracy devastated the city of Darwin, the population was 46,700 people (Australian Bureau of Statistics, 2008) approximately 43,500 of whom, were in Darwin at the time of the cyclone (Northern Territory Library, 1998). In 2012, ABC News reported that the population of Darwin had surpassed 200,000 for the first time in 2011, with a recorded population of 212,000. With such a large increase in the population, the aftermath of another cyclone similar to Cyclone Tracy would be catastrophic.
The abundance of cyclone safety precautions and preparation advice that are now available and used frequently during Darwin's cyclone season (November to April), through mediums such as checklists, social media, television and radio (as mentioned previously), allow for effective measures to be taken to avoid another tragedy like Cyclone Tracy. These tools alone however, can not provide sufficient information and warnings to the public of Darwin to readily prepare for a cyclone if there is no way of predicting if or when a cyclone is going to hit.
As stated above, there are several technological tools which do allow for this information and warning to occur, through radar images, satellite images, weather maps and MSLP charts, as well as loops of each of these to display the path of the storm over a period of time. Historically, tropical cyclones are known to be unpredictable, with some veering of the forecasted path, or even changing directions completely, which has lead to the effort and dedication to improve the forecasting skill in both location and intensity to ensure that residents of towns which are forecasted to be affected can be readily prepared and carry out any safety or evacuation protocols to ensure their safety and well-being (Bureau of Meteorology, 2014.)
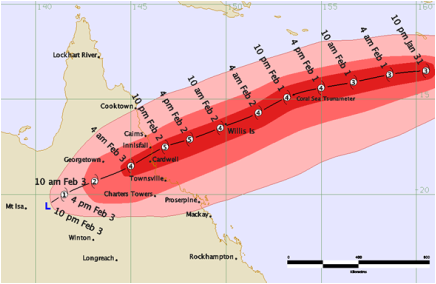
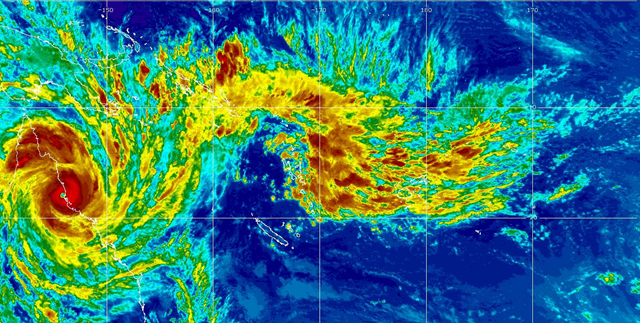
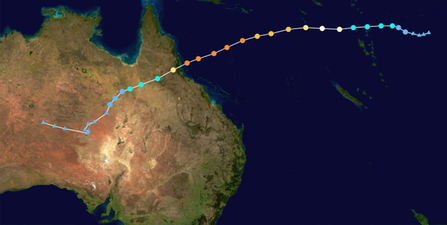
Figures below depict severe tropical cyclone Yasi, which developed as a tropical low northwest of Fiji on January 29th, 2011 and quickly intensified to a Category 5 tropical cyclone on February 2nd, before hitting northern Queensland early February 3rd, only weakening to a tropical low as it reached Mount Isa on February 3rd around 10pm (Bureau of Meteorology, 2014). These images in comparison to those shown above from 1974 are extremely different, with most having a substantially larger amount of informative and descriptive cues. Figure 2.1 shows Yasi through a radar image loop. Figure 2.2 shows Yasi through a satellite image loop. Figure 2.3 shows Yasi through a MSLP chart loop. Figure 2.4 shows a wind map still of Yasi. Figure 2.5 shows a colourised infared image still of Yasi as it struck Queensland on February 3rd. Finally, Figure 2.6 shows a tracking and intensity map still.
The abundance of cyclone safety precautions and preparation advice that are now available and used frequently during Darwin's cyclone season (November to April), through mediums such as checklists, social media, television and radio (as mentioned previously), allow for effective measures to be taken to avoid another tragedy like Cyclone Tracy. These tools alone however, can not provide sufficient information and warnings to the public of Darwin to readily prepare for a cyclone if there is no way of predicting if or when a cyclone is going to hit.
As stated above, there are several technological tools which do allow for this information and warning to occur, through radar images, satellite images, weather maps and MSLP charts, as well as loops of each of these to display the path of the storm over a period of time. Historically, tropical cyclones are known to be unpredictable, with some veering of the forecasted path, or even changing directions completely, which has lead to the effort and dedication to improve the forecasting skill in both location and intensity to ensure that residents of towns which are forecasted to be affected can be readily prepared and carry out any safety or evacuation protocols to ensure their safety and well-being (Bureau of Meteorology, 2014.)
Figures below depict severe tropical cyclone Yasi, which developed as a tropical low northwest of Fiji on January 29th, 2011 and quickly intensified to a Category 5 tropical cyclone on February 2nd, before hitting northern Queensland early February 3rd, only weakening to a tropical low as it reached Mount Isa on February 3rd around 10pm (Bureau of Meteorology, 2014). These images in comparison to those shown above from 1974 are extremely different, with most having a substantially larger amount of informative and descriptive cues. Figure 2.1 shows Yasi through a radar image loop. Figure 2.2 shows Yasi through a satellite image loop. Figure 2.3 shows Yasi through a MSLP chart loop. Figure 2.4 shows a wind map still of Yasi. Figure 2.5 shows a colourised infared image still of Yasi as it struck Queensland on February 3rd. Finally, Figure 2.6 shows a tracking and intensity map still.
|
Figure 2.1
Figure 2.3
|
Figure 2.2
Figure 2.4
|
|
Figure 2.5
|
Figure 2.6
|
Cyclones vary considerably in their strength and predictability, with some exhibiting rapid and unforeseeable changes in intensity, changes in the path or course and changes in speed, relating to changes in the surrounding environment (Bureau of Meteorology, 2014). This means that having appropriate and effective tools which accurately measure these changes is dire to the prevention of a catastrophe similar to that of Cyclone Tracy.
When comparing the images, maps and loops for Cyclone Tracy in 1974 and Cyclone Yasi in 2011, it is evident that there has been a significant development in the technology which is used to track, categorise and forecast tropical weather systems including tropical cyclones. In the above images of Cyclone Tracy in 1974 from reputable sources such as the Bureau of Meteorology and a satellite image from the National Oceanic and Atmospheric Administration (NOAA), the amount of detail and information which can be interpreted from these images is limited to those who have an abundant knowledge of reading these mediums. In the sources obtained from some of the same sources such as the Bureau of Meteorology, it is evident just how much these technologies have improved, with the clarity, resolution and amount of detail which are present in each of the figures shown above. The diversity in the appearance of each of these figures is clear, some contain high levels of information, figures and facts (Figure 2.1, 2.3 and 2.4) which are not easily understood, while others such as Figure 2.2. and 2.6 are very minimal, allowing for the general public to decode and interpret these with ease.
The Bureau of Meteorology (2014) explain that these improvements in technologies such as more accurate computer models and improved satellites mean that there have been significant improvements in the forecast accuracy. As well as this, a greater knowledge and understanding of the physics of tropical cyclone movements have ensured that the forecasts and tracking of tropical cyclones are accurate and allow for a greater chance to warn members of a populated area effectively and in an appropriate manner of time before the cyclone is forecast to hit in order to implement the proper safety precautions and protocols as well as evacuations when necessary.
Communication Technology and Methods

As well as the noted development in tracking and forecasting technologies, there has also been a dramatic increase in the number of household technologies which are used by a majority of Australia'a population in their daily lives. These technologies such as computers, laptops, the internet, mobile phones and fax machines have meant that in the event of a natural disaster, there would be a number of ways to communicate with others, assuming that all of these resources had not been completely destroyed.
In 1974 after Cyclone Tracy destroyed Darwin, the failure of communications and lack of available communication technologies meant that it was several hours before the word of what had happened reached officials in the southern cities of Australia, and it was only later that afternoon that the general public had become aware of the disaster (Department of Arts and Museums, 2014).
In 1974 after Cyclone Tracy destroyed Darwin, the failure of communications and lack of available communication technologies meant that it was several hours before the word of what had happened reached officials in the southern cities of Australia, and it was only later that afternoon that the general public had become aware of the disaster (Department of Arts and Museums, 2014).
